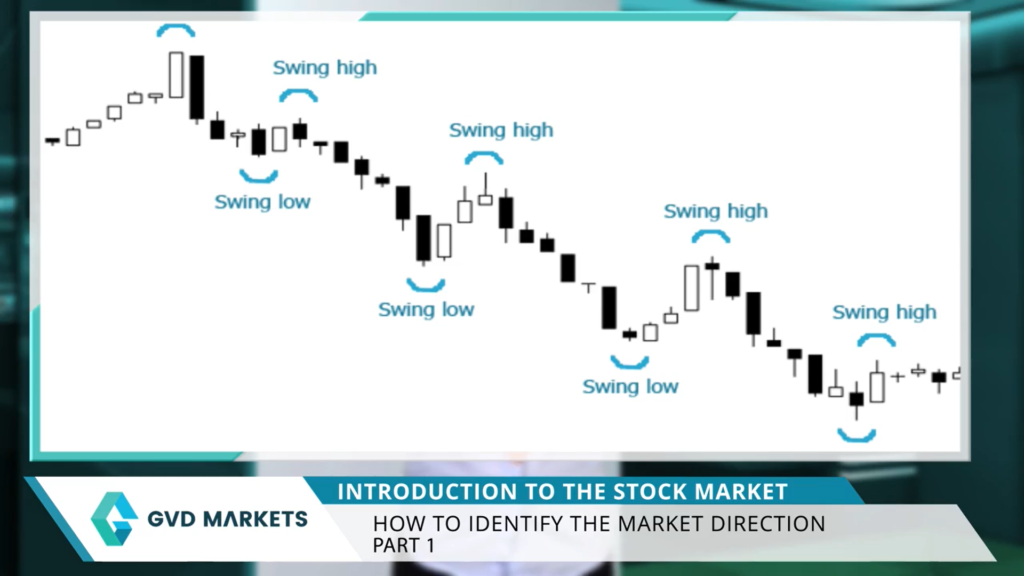
Technical Analysis We last parted with this image, so market trends are made of swing highs and swing lows or waves. Now wave is a very natural part of the market like we’ve seen before. Markets will generally move up and down in a gradual fashion over long periods of time when the market is in a downtrend, we get lower swing lows and lower swing hot. Now it’s easy to see on this chart that every swing low was lower than the previous one, and every swing high was lower than the previous one as well. Likewise, an uptrend has higher swing highs and higher swing lows, so a set of lower swing highs or lows every time means the market is in a downtrend instead of higher swing highs or lows means the market is in an uptrend. Words may confuse you, but if you look at a chart, things get much simpler. Now the question remains, how do we know that the market is changing direction? There are two things you should look at when the stock is in an uptrend and it breaks the previous swing low. The uptrend is now in question. When this happens, we’re looking to see whether this fall continues or not. We need one more thing. If the market makes a lower swing high and continues downwards, we have the characteristics of a downtrend with an uptrend. This means almost certainly that the uptrend is now over and the market will now either go sideways or in a full blown downtrend. It works the same with a downtrend when a previous swing high breaks and we get a higher swing low, the market continues upwards. We can safely assume the downtrend is over and a new uptrend has begun. Now, these are general principles you can use for all markets. Just make sure they’re not spiky or can not be read or have no volume. These will work great on Nasdaq charts. Let’s see the other side of things. Fundamental Analysis Now, fundamental analysis before we get into why some investors closely track a stock’s likely direction. Let’s look at a few indicators that help them with the task. While the financial markets have clearly stated business hours, developments outside of those hours continue to influence both the value of securities and investor behaviour, geopolitical events and natural disasters, for example, can occur at any time. Events like the assassination of a sitting president or a major terrorist attack are likely to indicate a lower market. Open corporate data also plays a role. Earnings announcements made after the close or before the open can influence the market’s direction In January April July and October, the vast majority of firms released their results for the quarter. Good news from a bellwether firm often leads to a higher stock market. Open bad news can have the reverse effect. Other important news comes out before the markets open. A wide variety of economic releases, including employment data, retail sales, and gross domestic product results, are released at eight 30 AM. Once again, both good news and bad news can sway the market. Open direction trading activity is also a common indicator. Extended hours trading takes place after the financial markets close for the day and before they open, this activity can help investors predict the open market direction. In fact, gauges such as the Nasdaq 100 premarket indicator SM, are designed specifically for this purpose. The Nasdaq 100 after hours indicator SM is a similar gauge. International Market Influence When domestic markets are closed for the day, international markets are open and trading a good day in Asian markets can suggest the us markets will open higher. Devastating losses overseas can lead to a lower open at home by paying attention to developments overseas, Domestic investors can get an idea about what direction they expect local markets to move when they open for the day. Major stock exchanges in Tokyo, Germany and London are often used as barometers for what will happen in the us. The futures market is yet another barometer used to predict the direction financial markets will move. Unlike the stock market futures markets never close. Futures contracts trade based on the values of the stock market benchmark indexes. They represent SP 500 futures trade based on the value of the standard Pause 500 just as the Dow futures trade based on the value of the Dow Jones Industrial average. Since the securities in each of the benchmark indexes represent a specific market segment, knowing the direction of pricing on futures contracts for those indexes can be used to project the direction of prices on the actual securities and the markets in which they trade. If SP futures are trending downward all morning, it’s likely that stock prices in the us exchanges will move lower when trading opens for the day. Once again, the opposite is also true, with rising futures prices suggesting a higher open, serious market watchers wake up early, pull the data and use these various indicators singly and in combination to discern the direction of the opening moves. In the us market, less ambitious investors just tune into the morning financial news broadcasts and let the talking heads provide an update on expectations for the day. Either way, it is possible to get a fairly solid reading on what to expect when us trading starts for the day.